LINCOLN HIGH SCHOOL SAFETY
The project that is being proposed here is to build security for understudies at Lincoln High School and to enable the students to recognize territories they find are dangerous near transportation hubs, for example, transport stops, and regions that encompass it. It's normal for students to find transport stops that are more secure than others based on experience. In this analysis we will be identifying public transport stops surrounding the high school that students perceive to be safe and dangerous. The idea is to find a pattern in areas that a multitude of students find unsafe and map it. This analysis is intended to help the students utilize all their resources of transportation, and to help them get involved with map making in the community to increase civic engagement. It would be beneficial for students if we could identify these risky areas to help Pierce Transit, Department of Transportation, and Tacoma Public Schools minimize areas that students avoid in their paths to and from school and to allow the students to voice their concerns and increase their civic engagements.
Lincoln High School Catchment Area | Tacoma, Washington
Lincoln High School is a historic high school located in the south central sector of Tacoma, Washington, adjacent to Lincoln Park. Part of Tacoma Public Schools, it was named for Abraham Lincoln, the sixteenth President of the United States. The school was founded in 1913 and built according to an architectural design by Frederick Heath. It celebrated its Centennial Jubilee in 2014.
Public Transportation Safety | Pierce County Transit
An audience is being targeted in this research proposal, and they are local. Actors that rank the highest in power for creating solution for the problems state above are Tacoma Public Schools, specifically Lincoln High School Admin, and Pierce County Transit. These are two local forces that could join to make the routes safest for students to use, and most efficient in time to promote safety within this catchment area. Once the areas are identified there are several more actors that can be influencers for making areas safe for these students. For instance, businesses could use this data to know where to set up certain commercial properties that are of use to students like for food, shopping and many more activities that these teenagers indulge in. The City might also be interested in this data to see why students are avoiding certain areas, because they could be more dangerous or high in criminal activities. The main audience is the school and local transit authorities. We could increase safety by knowing how frequently students are riding certain buses, and to increase safety write a proposal to possible lengthen or shorten certain bus routes that are being utilized most frequently by these students.
AVERAGE CRIME DENSITY | Pierce County Transit
The geocoded crime points were classified based on level of danger to student. For example, aggravated assault was classified as a 3, and high because this is a crime that can impact student’s safety greatly and direcly. Shoplifting was classified as a 1, or low, because this has the least impact of danger to students indirectly.
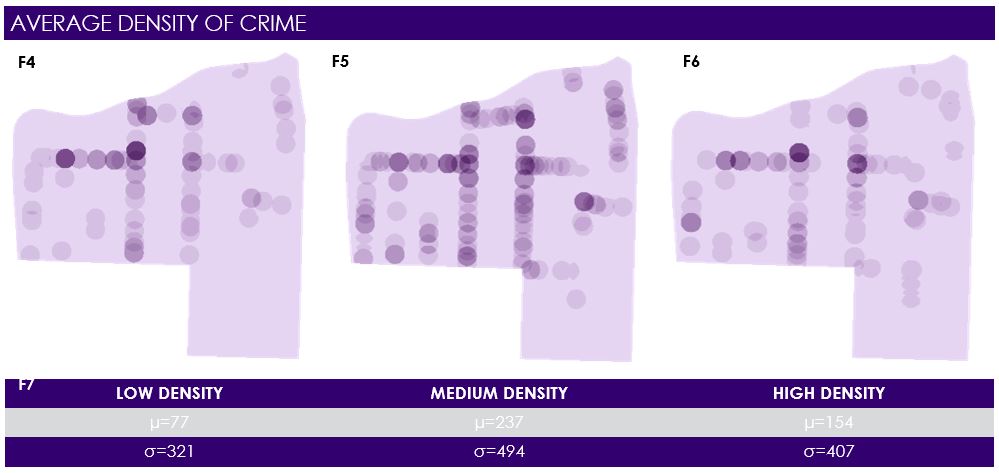
The figure above represents the average density of crime in the Lincoln High School catchment area. A point density analysis was done on each classification of crime, low, medium and high. The Point Density tool calculates the density of point features around each output raster cell (ESRI). With the results from this tool, average density of crime was calculated using zonal statistics finding x amount being the average crime in the Lincoln catchment area, and average for each point.These numbers are important because they indicate the average number of crimes, based on type of crime. Low crime = shoplifting, etc. Low crime are crimes that do not necesarrily put the students in harms way. Medium crime = Identity theft, etc. Medium crime has higher impact than lower crime, however it can still put students in direct danger. High crime = aggravated assault etc. High crime is direct harm to the student such as physical assault/violence.
When survey questions and answers were analyzed from questionnaires completed by students, the results were as expected from the hypothesis. The closer in proximity the bus stops are to Lincoln High School, the safer students perceive these bus stops to be. When looking at figure 8, a raster overlay of pilot data from the questionnaire that determines what streets and areas students perceive to be safe, the main street along the school is perceived to the safest, along with the bus points along this street, while almost every other arterial road in the catchment area is avoided according to the questionnaires. According to the average density of crime, low density crime occurs most frequently closest to Lincoln High School than any other area in the catchment area. Although there is crime in this area, the clear majority are classified as low, and are of the least harm to students. Also, when viewing the crime map (figure 2) that has been classified into low, medium, and high, this area also has the least amount of crime. This increases the perception of safety for the students as low crime occurs in the area, where other areas further away from the school frequently have medium, and high classified crimes for blocks.
Click here to learn more about the Action Mapping Project (AMP)